ThirdAveWind Application Tutorial
ThirdAveWind is an iPhone application that is dedicated to monitoring the Third Avenue kiteboarding and
sailboarding weather instrument mounted on top of, and the network ptz camera mounted inside of the Electronics
for Imaging building in Foster City, CA. If you wish to return to the application, please select the following link: ThirdAveWind (only from an iPhone that has it installed of course).
Download the Tutorial as PDF
The most recent version of the tutorial is available as a download in PDF (~25 MB) HERE.
General Setup
The application is divided into several types of views:
- Dial, Meter and Gauge views show near-realtime data values
- History views show historical data for the data presented in the dial view
- Sensor data shows attributes and their values for attributes not presented in dial/history form
- Camera views shows image views of various important viewpoints
In addition, there is a view that points to the Arbor Studios site that is always available off any of the dial views.
The following sections describe each of these view types in detail.
Dial Views
There are three dial views available on the main/startup screen:
- Wind and Direction and Speed View shows the current wind direction and speed
- Gust View shows the current gust values in speed
- Temperature View shows the current temperature value and ranges
Title Area
At the top of every dial view is an information area that provides textual values of the current conditions. Just below it is an area that describes when the information being displayed (above or in the dial) was last updated.
Tab Area
At the bottom of every dial view is a tab area where you can select other dial views (Wind, Gust, and Temperature), a Sensor view, or Camera views. Selecting any of these will swap the main view to that view.
Background Views
Underlying every dial and history view is a background image. This image changes with wind speed according to the following logic:
- 0-11 mph
- 12-16 mph
- 17-26 mph
- 27+ mph
Additionally, when the current time is between sunset and sunrise the background image will change to an evening image.
Background Sounds
At the bottom middle of every dial view is an icon  that toggles sound on and off. The audio in the application is run in a thread that lasts about 30 seconds, so sounds will turn on and off in that duration. The audio clips in the application change with the same wind speed values as the background images. The default is for sound to be off.
Arbor-Studios Home Page
At the bottom left of every dial view is an icon  that opens a view that describes the application and has a button that will launch the Arbor-Studios home page in Safari. It will not return when done, so you will have to relaunch ThirdAveSuite if you select this button.
Toggle to History View
At the bottom right of every dial view is an icon  that rotates the dial view into the History view. Selecting the Done button at the top of the history view, or selecting the view by name in the tabs at the bottom of the view, will return you to a dial view.
Wind Direction and Speed View
The figure below identifies all of the features available on the main application view  , which is the wind direction and speed view. Depicted in the center of the screen are two concentric dials. The outer dial is a compass rosette and has two dial hands. The larger (yellow/gold) dial hand shows the current/instantaneous wind direction. The smaller (red) dial hand (not visible in this image because it is the same as the current direction) shows the 10-minute average wind direction. As can be seen, the speed dial is only capable of showing wind speeds up to 60 mph.
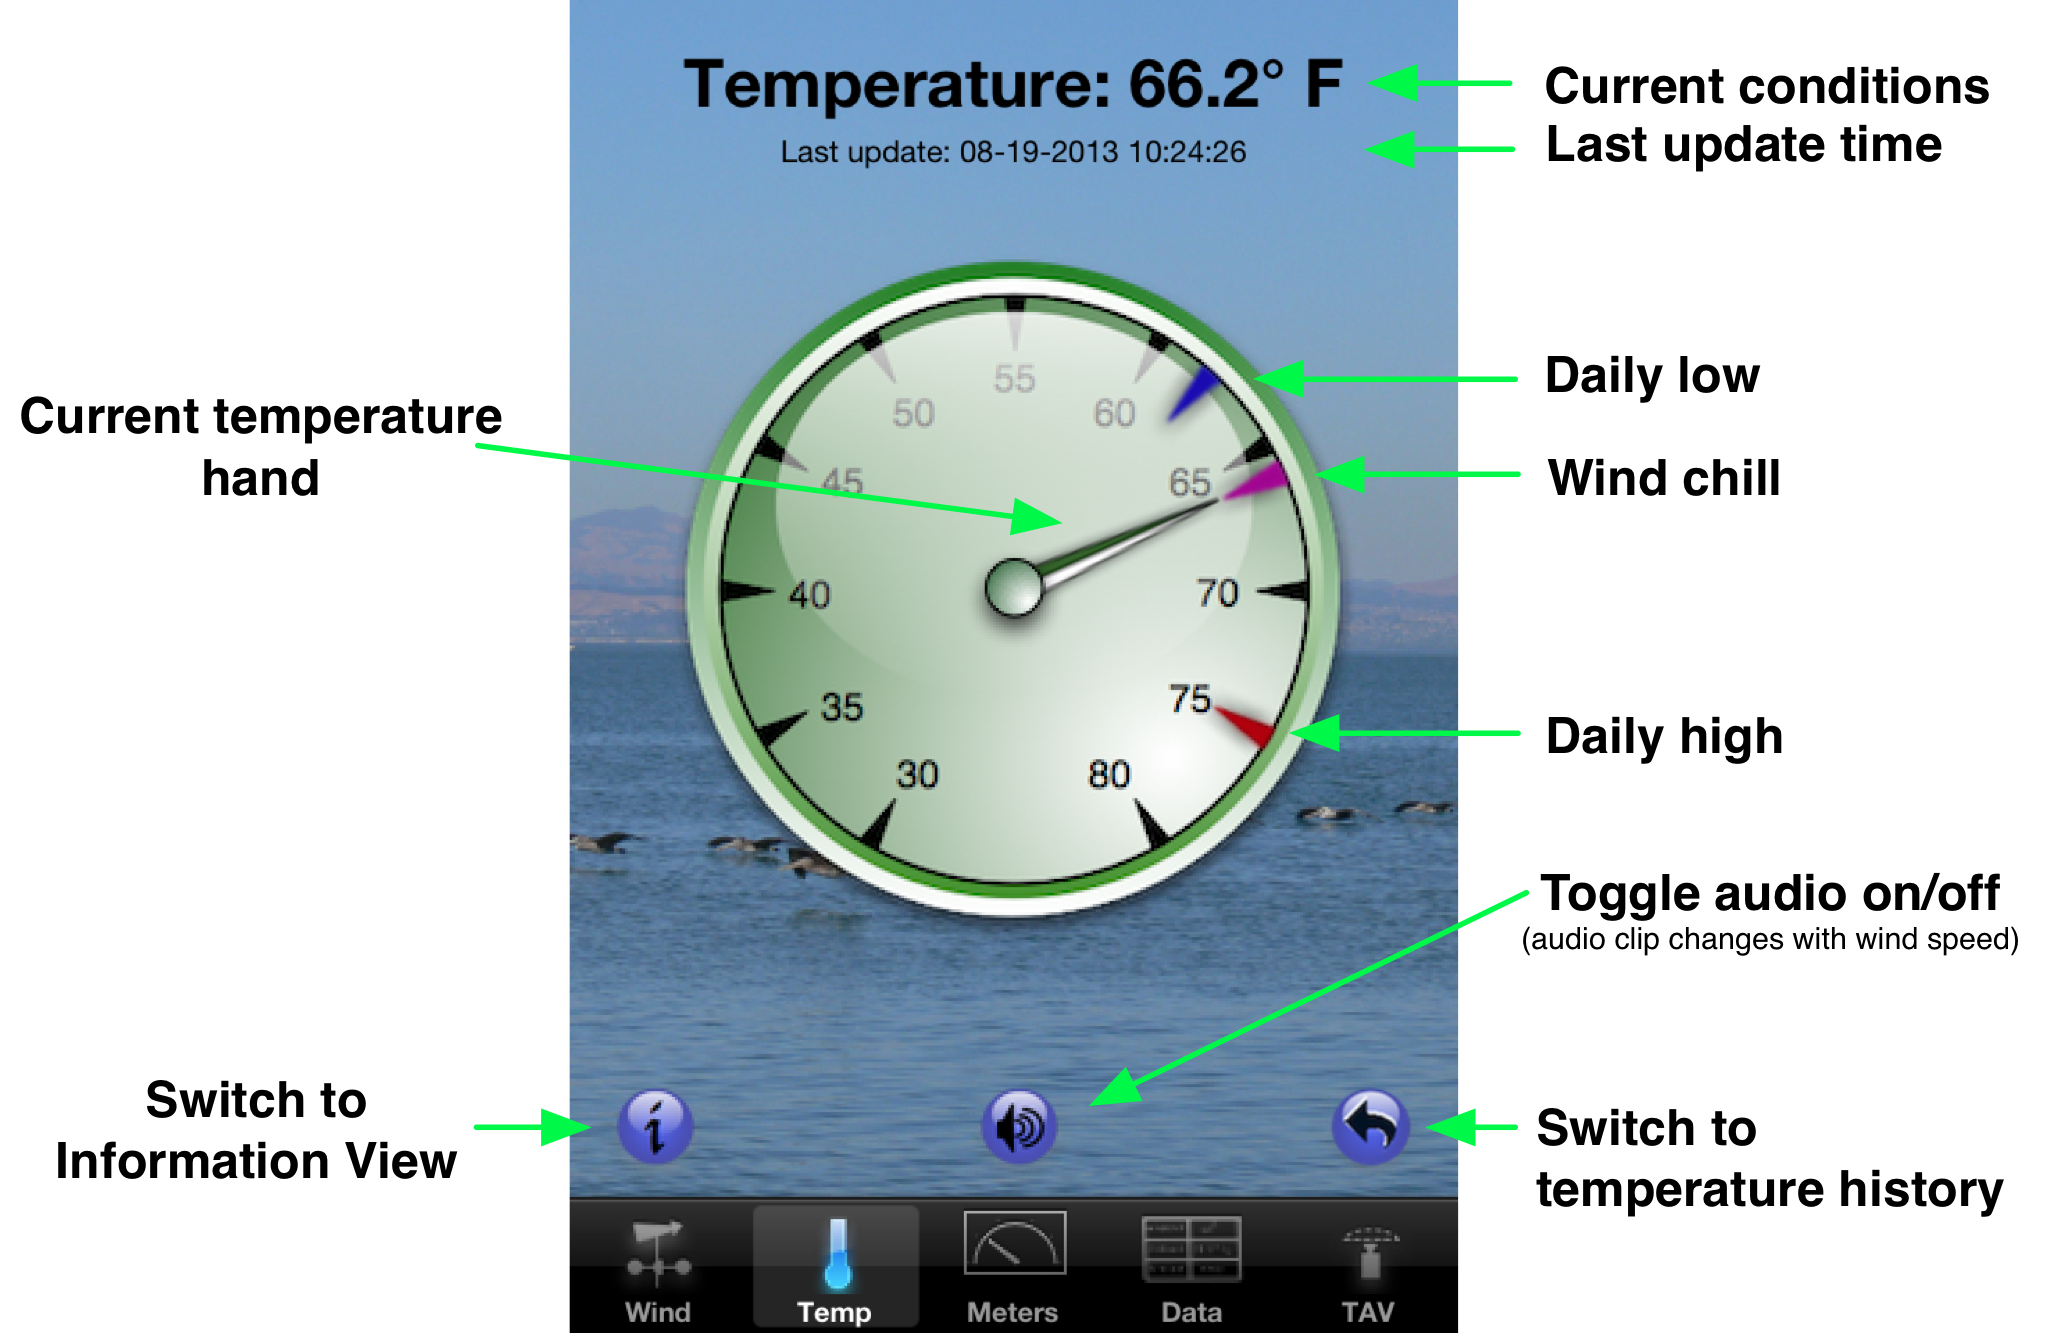
Temperature View
The figure below identifies all of the features available on the Temperature dial  . This view depicts the current temperature as well as the daily low and high temperatures. The current temperature is displayed using the main dial hand. The mini blue dial hand is used to display the day's low temperature value, while the mini red dial hand is used to display the day's high temperature value.
Meter and Gauge View
The figure below identifies all of the features available on the Meter view  . This view depicts the current gust barometric pressure and humidity values. These values are are updated approximately 4 times a minute.
When the 'Flip' icon ( ) is selected the Meter view will rotate into the Gauge view. You can
return to the Meter view by selecting the 'Done' button on the Gauge view. The Gauge view shows 3 gauges: (1) a rainfall gauge,
(2) a cloudbase gauge, and (3) a tide gauge, as depicted below:
) is selected the Meter view will rotate into the Gauge view. You can
return to the Meter view by selecting the 'Done' button on the Gauge view. The Gauge view shows 3 gauges: (1) a rainfall gauge,
(2) a cloudbase gauge, and (3) a tide gauge, as depicted below:
History Views
There is a history view for each dial view, so there are three history views (one for wind speeds, one for gusts, and one for temperatures). This tutorial only shows a legend for the wind history view as the temperature history views use the same display and axes. The wind and temperature history views each have two graphs, one for the values over the past hour, displayed on top, and one for the values over the past 24 hours, displayed at the bottom. In addition, the last hour's wind speed history has superimposed on top of it the gust history over the past hour, to give an indication of the stability of the air. It is important to note that on each of these graphs the most current time is the farthest to the right, while the most ancient is the farthest to the left. This is why the horizontal axis is labeled in negative values with the 0 value (now) being on the far right.
Wind History Data View
Temperature History Data View
Below is an example showing the temperature history graphs.
Sensor Data View
The sensor view  presents a table of about 30 attribute/value pairs that do not make sense to show in a dial or history view but are valuable nonetheless. The image below describes how to interpret the view.
First Sensor Data View
Along the left side of the table are displayed the sensor attribute names (e.g., Date, Sunset, Forecast, Windchill, Cloudbase, etc.). Along the right are displayed those attribute's values. The attribute names will also include (parenthetically) the unit categories for those attributes that have units. For example, temperatures are displayed in Degrees Fahrenheit while Pressure is displayed in Inches of Mercury.
Latitude and Longitude
These are the values of the weather station location.
Moon Phase
There are generally 30 days in a month, and there are 30 images in this set. The data values provided from the weather station describe moonphase in percentages. These percentages are then multiplied by the number of images to determine which one to display. They will generally be pretty close to the moon phase that you see in the sky.
Forecast Icon
Forecast icons will change depending on the half of the day that is currently in effect. That is, if it is between sunrise and sunset "daytime" forecast icons will be displayed, while if it is between sunset and sunrise the "nighttime" forecast icons will be displayed. The algorithm for selecting forecast icons has been rewritten to favor windy conditions. Before the application displayed whatever forecast icon was delivered from the weather instrument. More recently, as mentioned, the algorithm would distinguish between daytime and nighttime conditions. Now the algorithm checks to see if the forecast says that it is windy or, if, in fact, it is actually windy (using the same values used to switch between background images). If so, then a windy icon is selected.
Forecast
The forecast string is a combination of current conditions and a generic forecast that is conjured up from the temperature, pressure, wind speed, humidity, cloudbase (I am guessing here). The application has been modified to support variable-height table cells to accommodate long forecast strings.
Second Sensor Data View
If you were to touch-pan the table upward past the forecast you would see another 9 items as shown below.
Previous, Current, and Next Tide
Tide information has been acquired from the NOAA Tide Predictions site for the San Mateo Bridge, West End. Three days are being acquired: today, yesterday, and tomorrow. This guarantees that there will always be data for two full tide cycles in any given day, so previous and next tide values will be data from the NOAA site. For the current tide value these two bounding values are interpolated. Each tide value is displayed with the time and value, so by looking at the previous and next values you can tell which was the high tide, which was the low tide, and whether it is currently flooding or ebbing.
Cloudbase
Our site is very sensitive to cloud cover since the winds on the bay are mostly generated as a result of convection between San Francisco and San Jose. So high clouds can shut our convection down and stratus can either kill us altogether or signal a low-pressure system that could be stable but most likely southerly in nature. So cloudbase can be a useful prediction mechanism.
Barometric Pressure
Barometric pressure and, more importantly, barometric pressure trends, are very helpful in predicting weather and winds.
Humidity
Humidity is a measure of the water content in the air. San Francisco can show relatively high levels of humidity and still feel dry, but if the values reach above 60% rain is likely.
Temperature and Windchill
For some the air temperature and windchill are determining factors in whether they are willing to go out (me for one). The values here can provide you with some extra decision-making information in that regard.
Third Sensor Data View
If you were to touch-pan the table upward past the forecast you would see the last few items as shown below.
Rainfall Measures
Rainfall usually tells us that kiting is not going to happen, whereas it can sometimes mean a good sailboarding session. If it was raining and is now sunny or partly cloudy a clearing wind might be happening or about to happen, so measurements of rainfall can be very helpful.
Camera Views
The application supports five (5) different photographic views of the Third Avenue kiteboarding and sailboarding site acquired from our Sony PTZ network camera:
- Parking Lot (
 ) shows a view of the main parking lot
- Carpeted Area and Flag (
 ) shows the main setup area and the flag by the sailboard ramp
- Jump (
 ) shows the main kiteboarding jumping area at the corner of the path, to the right of the sailboarding ramp
- Beach (
 shows the lower beach setup area
- Panoramic (
 ) shows a panoramic view created by stitching together 33 images together (3 rows of 11 images)
The camera views are accessed from any of the dial or history views from the tab on the far right labeled "tav". When selected, the ThirdAveView application will be launched (if installed). All of the camera views look the same so only one will be described as a legend. Each image is implemented with a Pan and Zoom view that supports tap functionality. What this means is that you can use your finger to scroll left and right, up and down. In addition, you can use double taps to zoom in, and two-finger taps to zoom out. You can use pinch and stretch two-finger motions to zoom out and in, but it doesn't seem to work very well right now.
Parking Lot View
Wind Flag and Ramp View
The camera view for looks as follows.
Lower Beach View
The camera view for looks as follows.
Jump Area View
The camera view for looks as follows.
Panoramic Views
The camera view for looks as follows. It is a large image that takes a while to load but is worth the wait. Here are shown 3 images scrolling left to right
Weather Data Dials/Buttons
Below the upper bar on each camera view there are two dial images. The one on the left  shows a miniature compass rose with a number in it. The dial in the rose is displaying the currently correct wind direction, while the number displayed is showing the currently correct wind speed value. You can touch the dial because it is implemented as a button. When it lights up it will be easier to read the value. The dial on the right (
 ) displays the current tide type (ebb or flood) and the current tide value. If the tide is an ebb tide (as shown) then the right side of the sine wave will be highlighted, while if the tide is a flood (
 ) the left side of the sine wave will be highlighted (as shown). Note the darker section for each example.
Both of these dials are implemented as buttons, and if you select either one it will return you to the ThirdAveWind application.
General Operation
Each of the views is designed to fit vertically in as much of the space as is available. This means that you are only viewing a 'band' of the image, and can scroll (or pan) to the left or right by swiping your finger across the image. You can double tap the screen to zoom in, and of course you can also use pinch and stretch motions to zoom out or in.
Clearly the most dramatic of all the views is the panoramic view. Unfortunately, it is a very large image (almost 1 MB) so it takes a long time to load. When it does, it will be worth the wait, because it has been stitched together from 33 separate images and allows you to scroll from almost the north end on the left all the way to Inktomi on the right. It may not load on older (3G and before) iPhones. In fact, it may crash the application. If the panoramic view opens in zoomed mode it will probably do so for the entire day, and will not respond to zoom out touch events. This is not a problem with the application but with the software controlling the camera.
Space Provided By Hurricane Electric